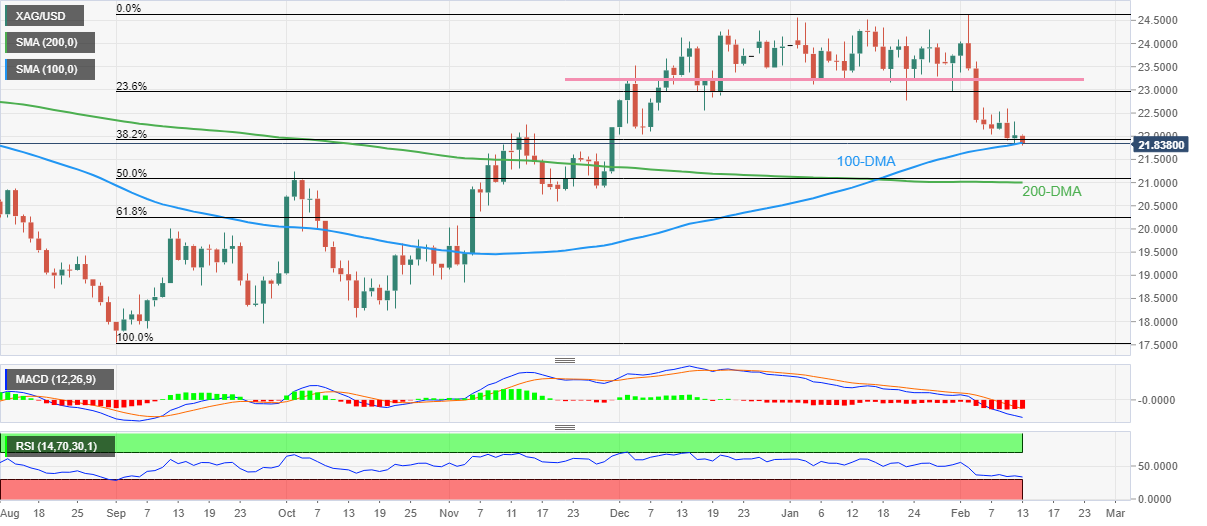
- Silver price takes offers to renew multi-day low, fades the previous day’s corrective bounce off 100-DMA.
- Bearish MACD signals, failure to rebound from key DMA favor XAG/USD sellers.
- Nearly oversold RSI (14) line challenges further downside of metal.
- 200-DMA lures Silver bears unless XAG/USD stays below $23.25.
Silver price (XAG/USD) drops 0.85% intraday as it renews the 2.5-month low near $21.80 during early Monday. In doing so, the bright metal pokes the 100-DMA while reversing the previous day’s corrective bounce off the multi-day low.
Given the quote’s inability to rebound from the 100-DMA, as well as the bearish MACD signals, the XAG/USD sellers are likely to keep the reins. However, the 200-DMA support, close to the $21.00 round figure, appears a tough nut to crack for the Silver bears.
Hence, the precious metal is likely to break the immediate DMA support surrounding $21.80 but may witness a limited downside.
It’s worth noting that the October 2022 peak surrounding $21.25 may act as an extra filter towards the south, before hitting the 200-DMA.
Meanwhile, Silver buyers need to portray a successful recovery beyond November 2022 peak surrounding $22.25 to regain the market’s confidence.
Even so, a horizontal area comprising multiple levels marked since early December 2022, close to $23.25, could challenge the XAG/USD bulls.
Following that, a jungle of resistances around $24.30 may test the Silver buyers before directing them to the monthly high of around $24.65, also the highest since April 2022.
Silver price: Daily chart

Trend: Limited downside expected
ADDITIONAL IMPORTANT LEVELS
| OVERVIEW | |
|---|---|
| Today last price | 21.82 |
| Today Daily Change | -0.20 |
| Today Daily Change % | -0.91% |
| Today daily open | 22.02 |
| TRENDS | |
|---|---|
| Daily SMA20 | 23.29 |
| Daily SMA50 | 23.43 |
| Daily SMA100 | 21.83 |
| Daily SMA200 | 21 |
| LEVELS | |
|---|---|
| Previous Daily High | 22.31 |
| Previous Daily Low | 21.84 |
| Previous Weekly High | 22.62 |
| Previous Weekly Low | 21.84 |
| Previous Monthly High | 24.55 |
| Previous Monthly Low | 22.76 |
| Daily Fibonacci 38.2% | 22.13 |
| Daily Fibonacci 61.8% | 22.02 |
| Daily Pivot Point S1 | 21.8 |
| Daily Pivot Point S2 | 21.58 |
| Daily Pivot Point S3 | 21.33 |
| Daily Pivot Point R1 | 22.27 |
| Daily Pivot Point R2 | 22.53 |
| Daily Pivot Point R3 | 22.75 |


